Attendance Forecast
Last updated: October 21, 2026
Panorama's Attendance Forecast helps educators identify students who may be at risk of future absenteeism earlier than traditional attendance metrics alone. It combines a student’s current absence rate with research-backed attendance pattern signals to estimate likely attendance risk for the rest of the school year.
Who this is for: Educators who want to understand how Attendance Forecast works
Related articles:
What is Attendance Forecast
Attendance Forecast is a research-backed attendance risk indicator in Student Success. It is designed to help educators move from retrospective attendance monitoring to earlier, more proactive intervention.
Instead of looking only at how many days a student has missed so far, the feature also considers how those absences are distributed. Panorama research found that absence patterns provide meaningful predictive value beyond total absences alone.
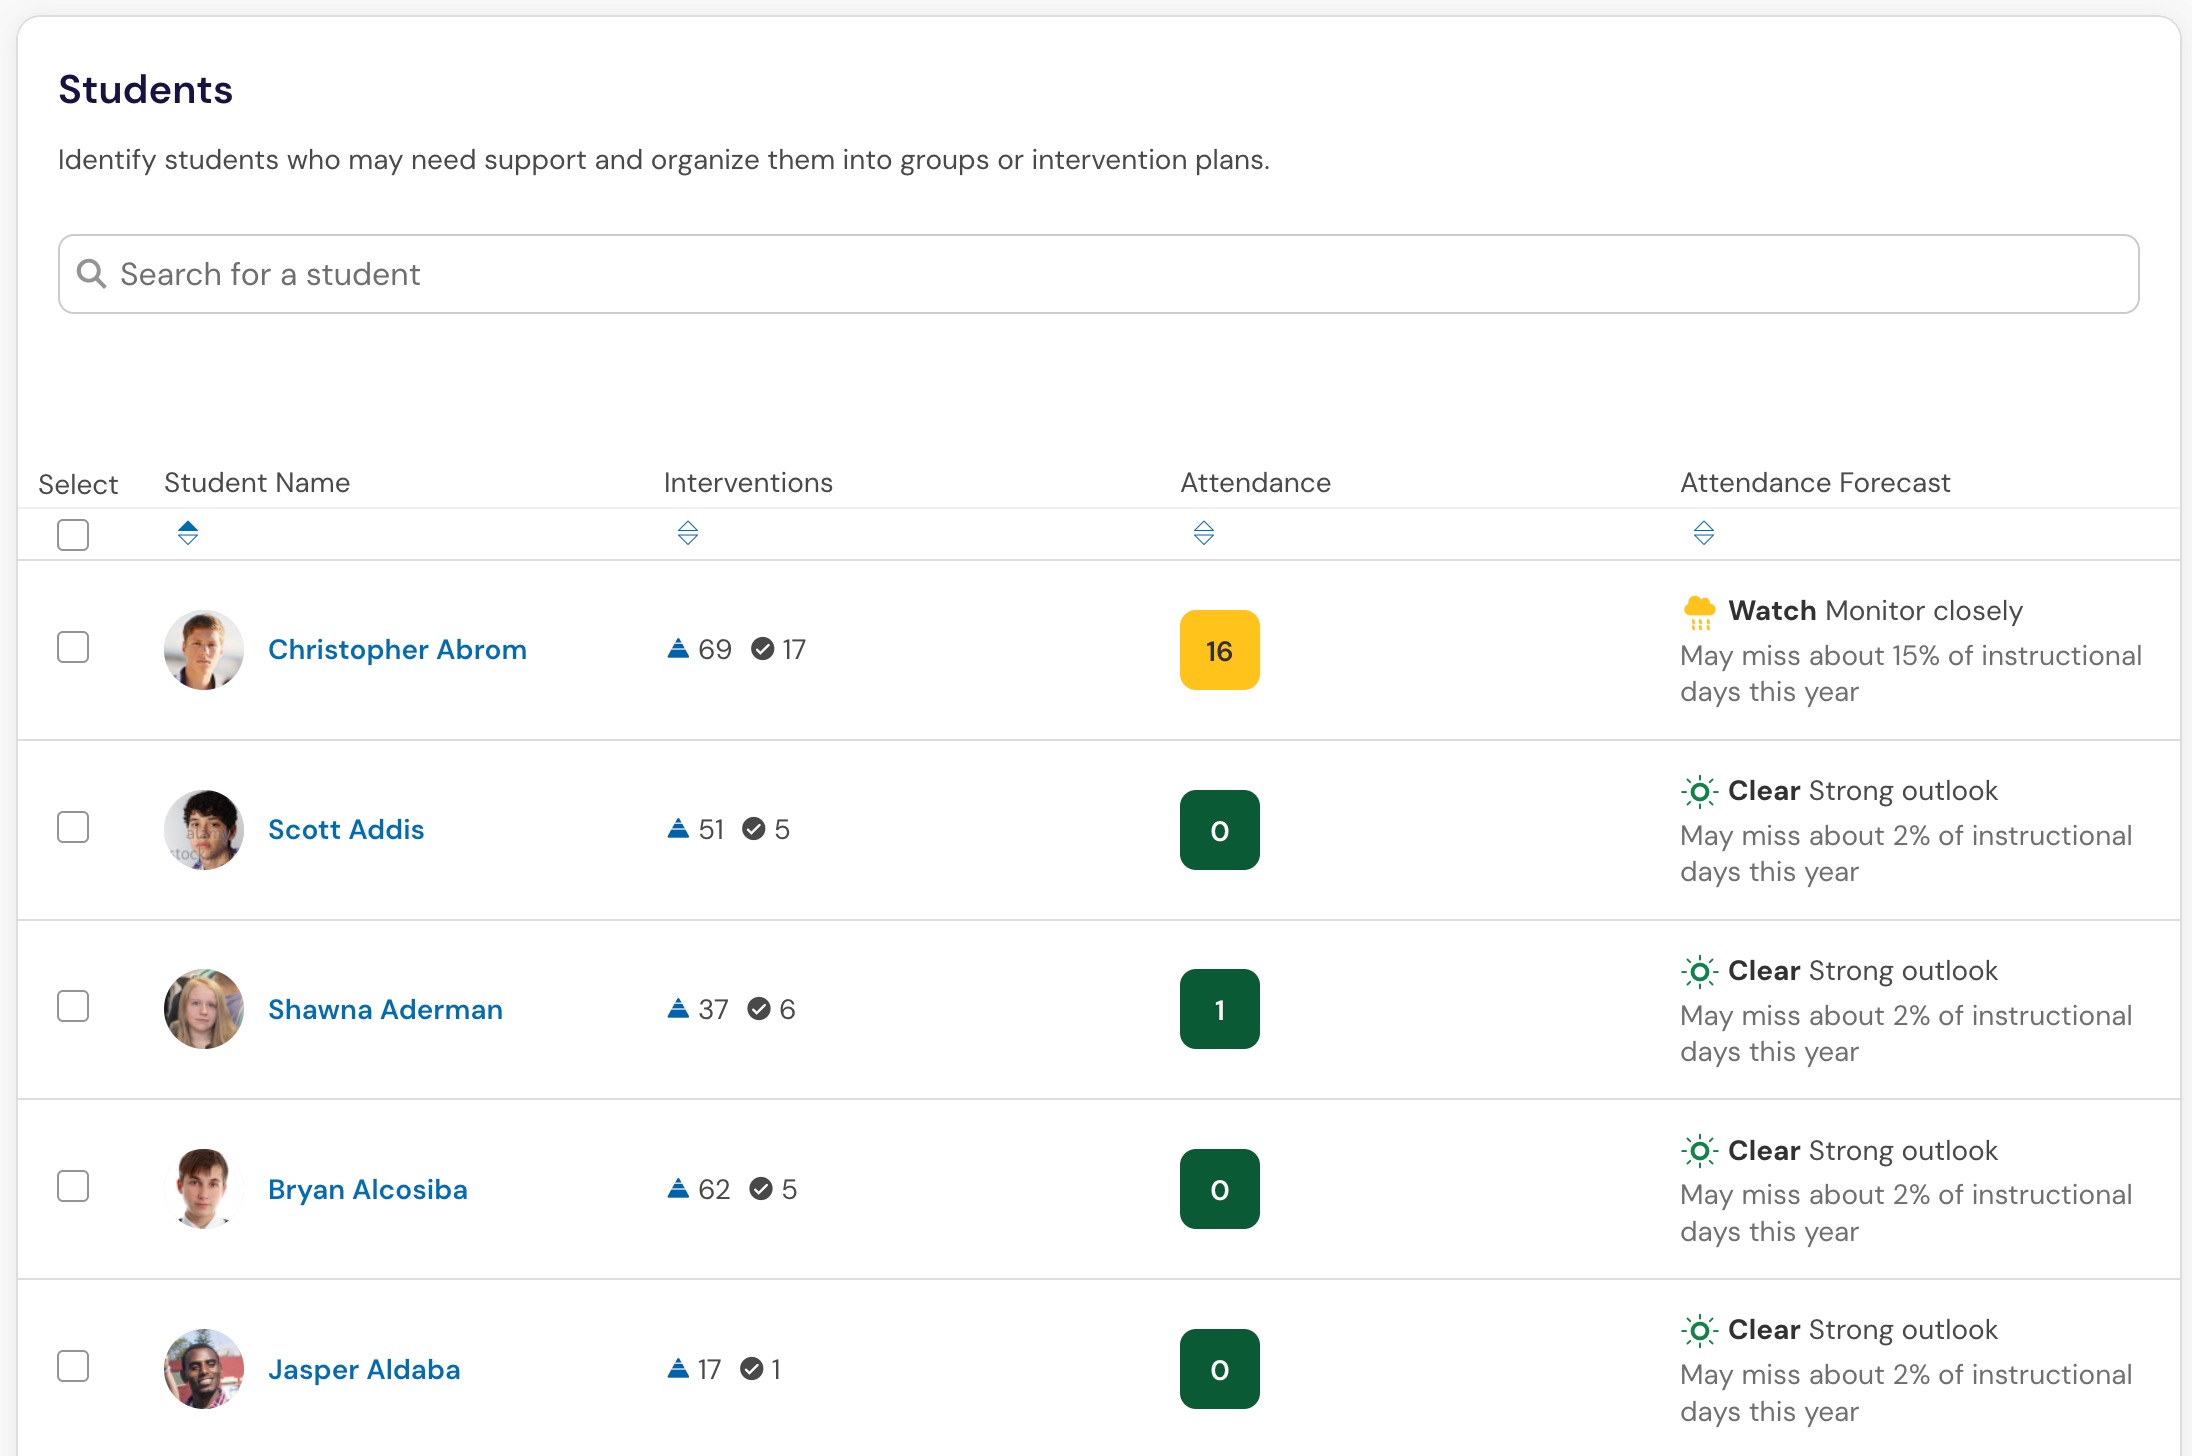
Attendance Forecast presents this information as simple, educator-friendly designations:
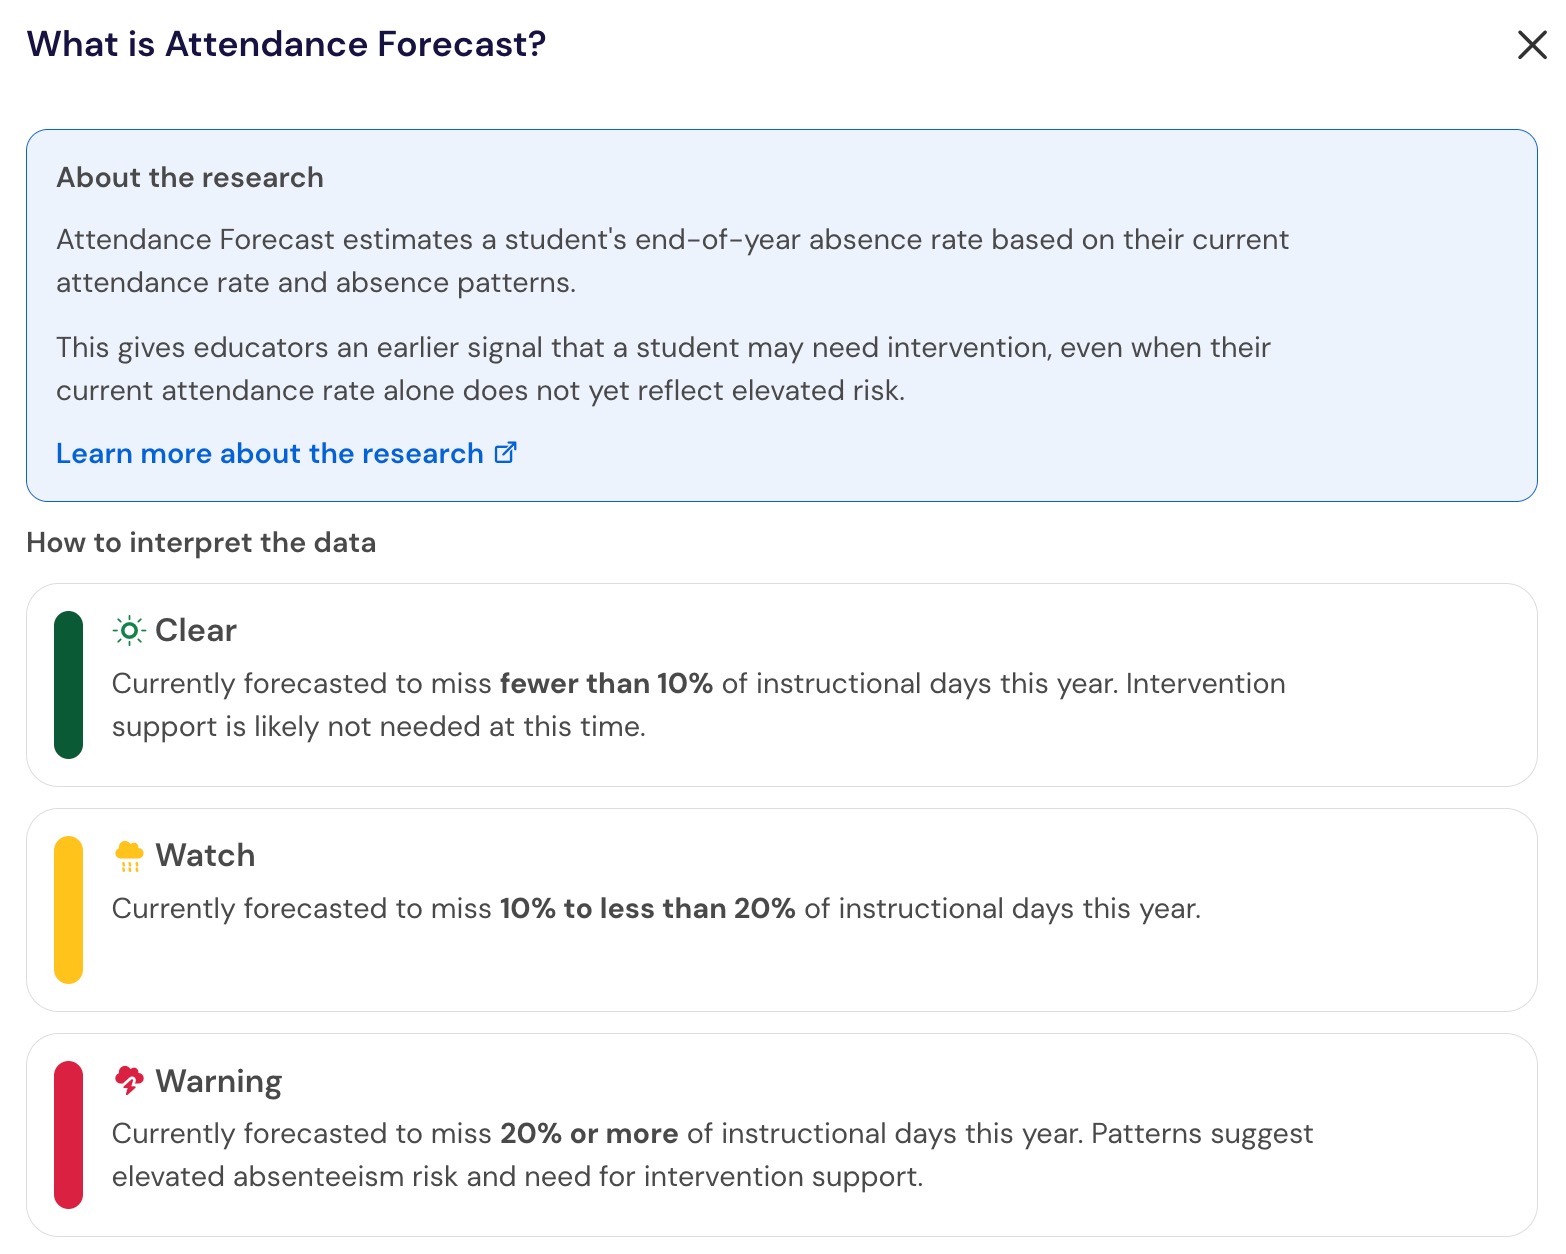
Clear — lower projected attendance risk
Watch — moderate projected attendance risk
Warning — elevated projected attendance risk
Why Attendance Forecast matters
Traditional attendance metrics are useful for reporting outcomes, but they often surface risk too late. Districts commonly rely on attendance percentage or chronic absenteeism thresholds, which can identify a problem only after a pattern is already well established.
Attendance Forecast was built to address two practical problems for educators:
Absence totals alone do not tell the full story. Two students can have similar year-to-date attendance rates while facing very different future attendance trajectories.
Many existing indicators arrive too late for early intervention. By the time a student is clearly chronically absent on a traditional metric, important outreach opportunities may already have been missed.
Panorama’s research across more than 11 million student-year observations found that attendance patterns, especially absence streak behavior, improve prediction of future absenteeism compared with absence rate alone.
How Attendance Forecast works
Attendance Forecast estimates a student’s projected full-year absence rate using a fixed linear model. It then translates that estimate into a simple category that educators can use in day-to-day workflows.
The current model uses four inputs derived from the student’s attendance record:
Current absence rate — how many days the student has missed so far
Number of absence streaks — how many separate absence events the student has had
Longest absence streak — the longest continuous run of absences
Percent of year complete — how far along the school year is
Research behind Attendance Forecast
Holding total absences constant, students with more absence streaks are more likely to miss more school.
Students with a longer single continuous streak tend to have lower future absence rates than students whose absences are spread across more separate streaks, when comparing similar totals.
Adding streak features to absence rate improved forecasting performance and outperformed approaches based on day-of-week absence patterns.
Simple example
Consider two students early in the year:
Student A: 5 absences in 1 continuous streak
Student B: 3 absences across 3 separate streaks
Even though Student A has more total absences, Panorama’s research found that students with patterns like Student B had a higher average future absence rate than students with patterns like Student A.
Patterns of attendance matter, not just totals.
Forecast categories at launch
The UI displays the forecast as a rounded integer percent to avoid overstating precision.
A streak is one or more consecutive full-day absences on instructional weekdays. A single missed day counts as a streak. Non-instructional days are ignored, so a Friday absence followed by a Monday absence counts as one continuous 2-day streak if no school occurred in between.
Category | Predicted full-year absence rate |
|---|---|
Clear | 0% to 9.999% |
Watch | 10% to 19.999% |
Warning | 20% and above |
Where it appears
Attendance Forecast appears within existing attendance experiences so educators can find the information quickly from their familar tools and workflows.
It appears in these places:
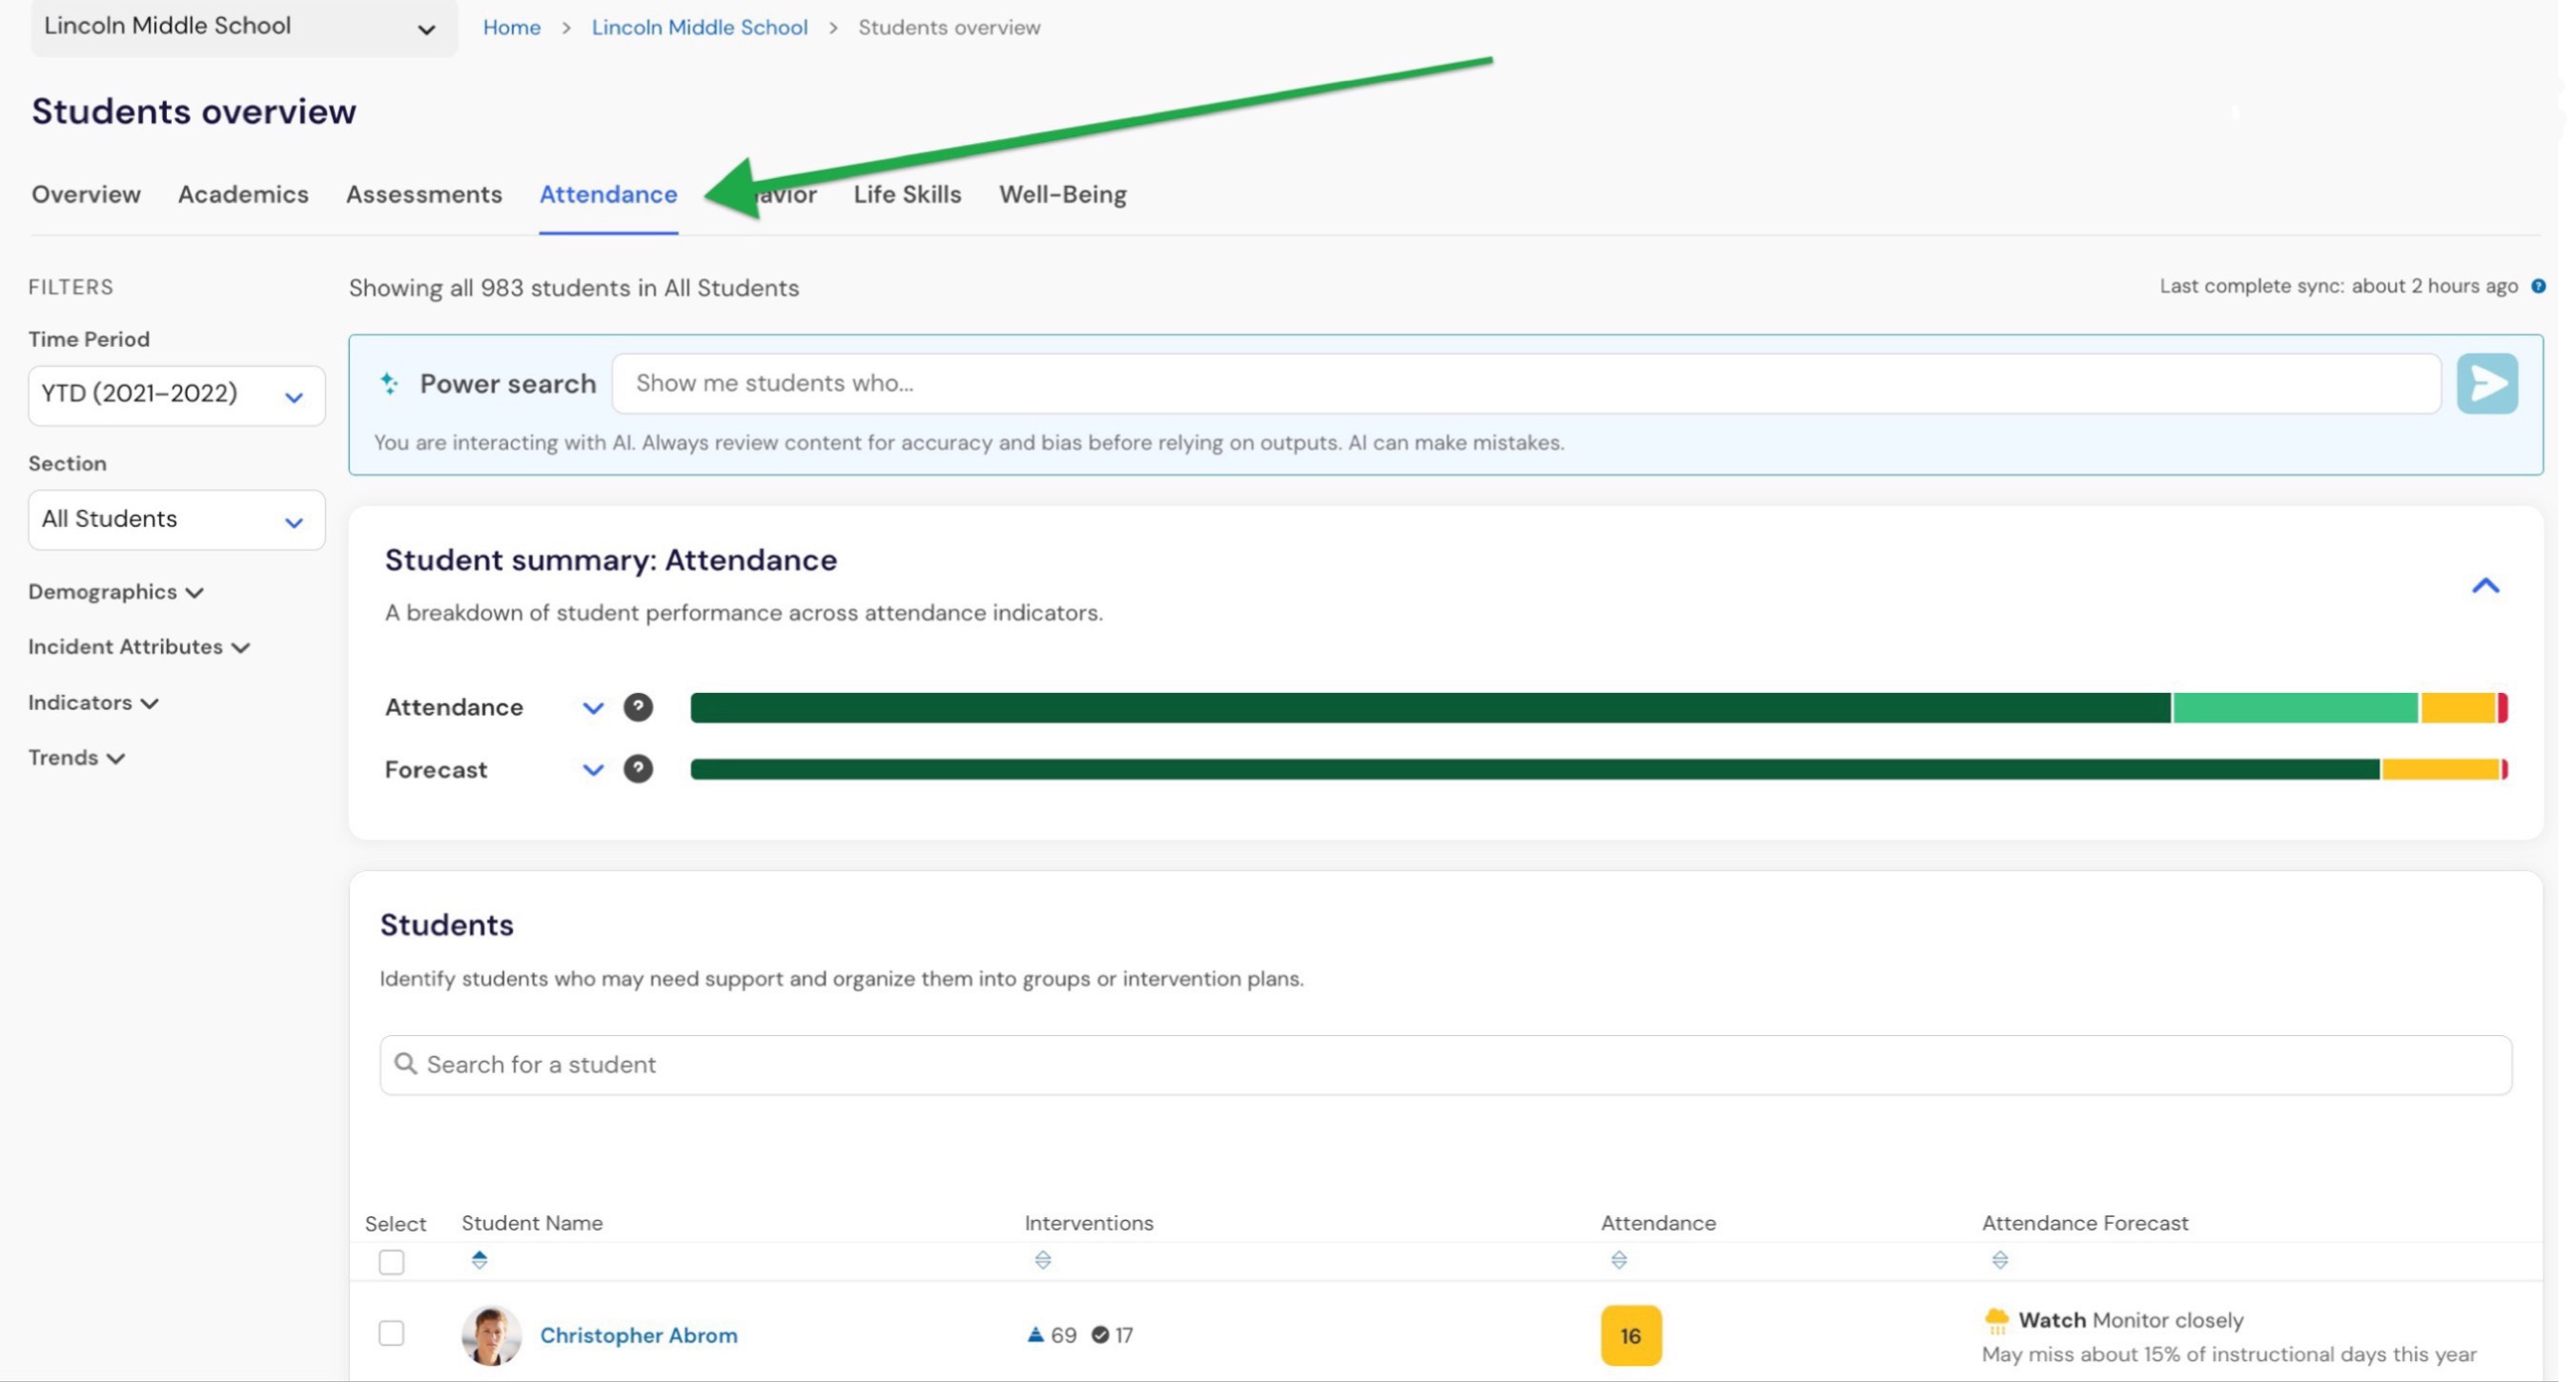
Attendance Overview
Attendance Forecast helps educators quickly scan for students with elevated projected attendance risk. Teams can isolate students in Watch or Warning to focus intervention planning.
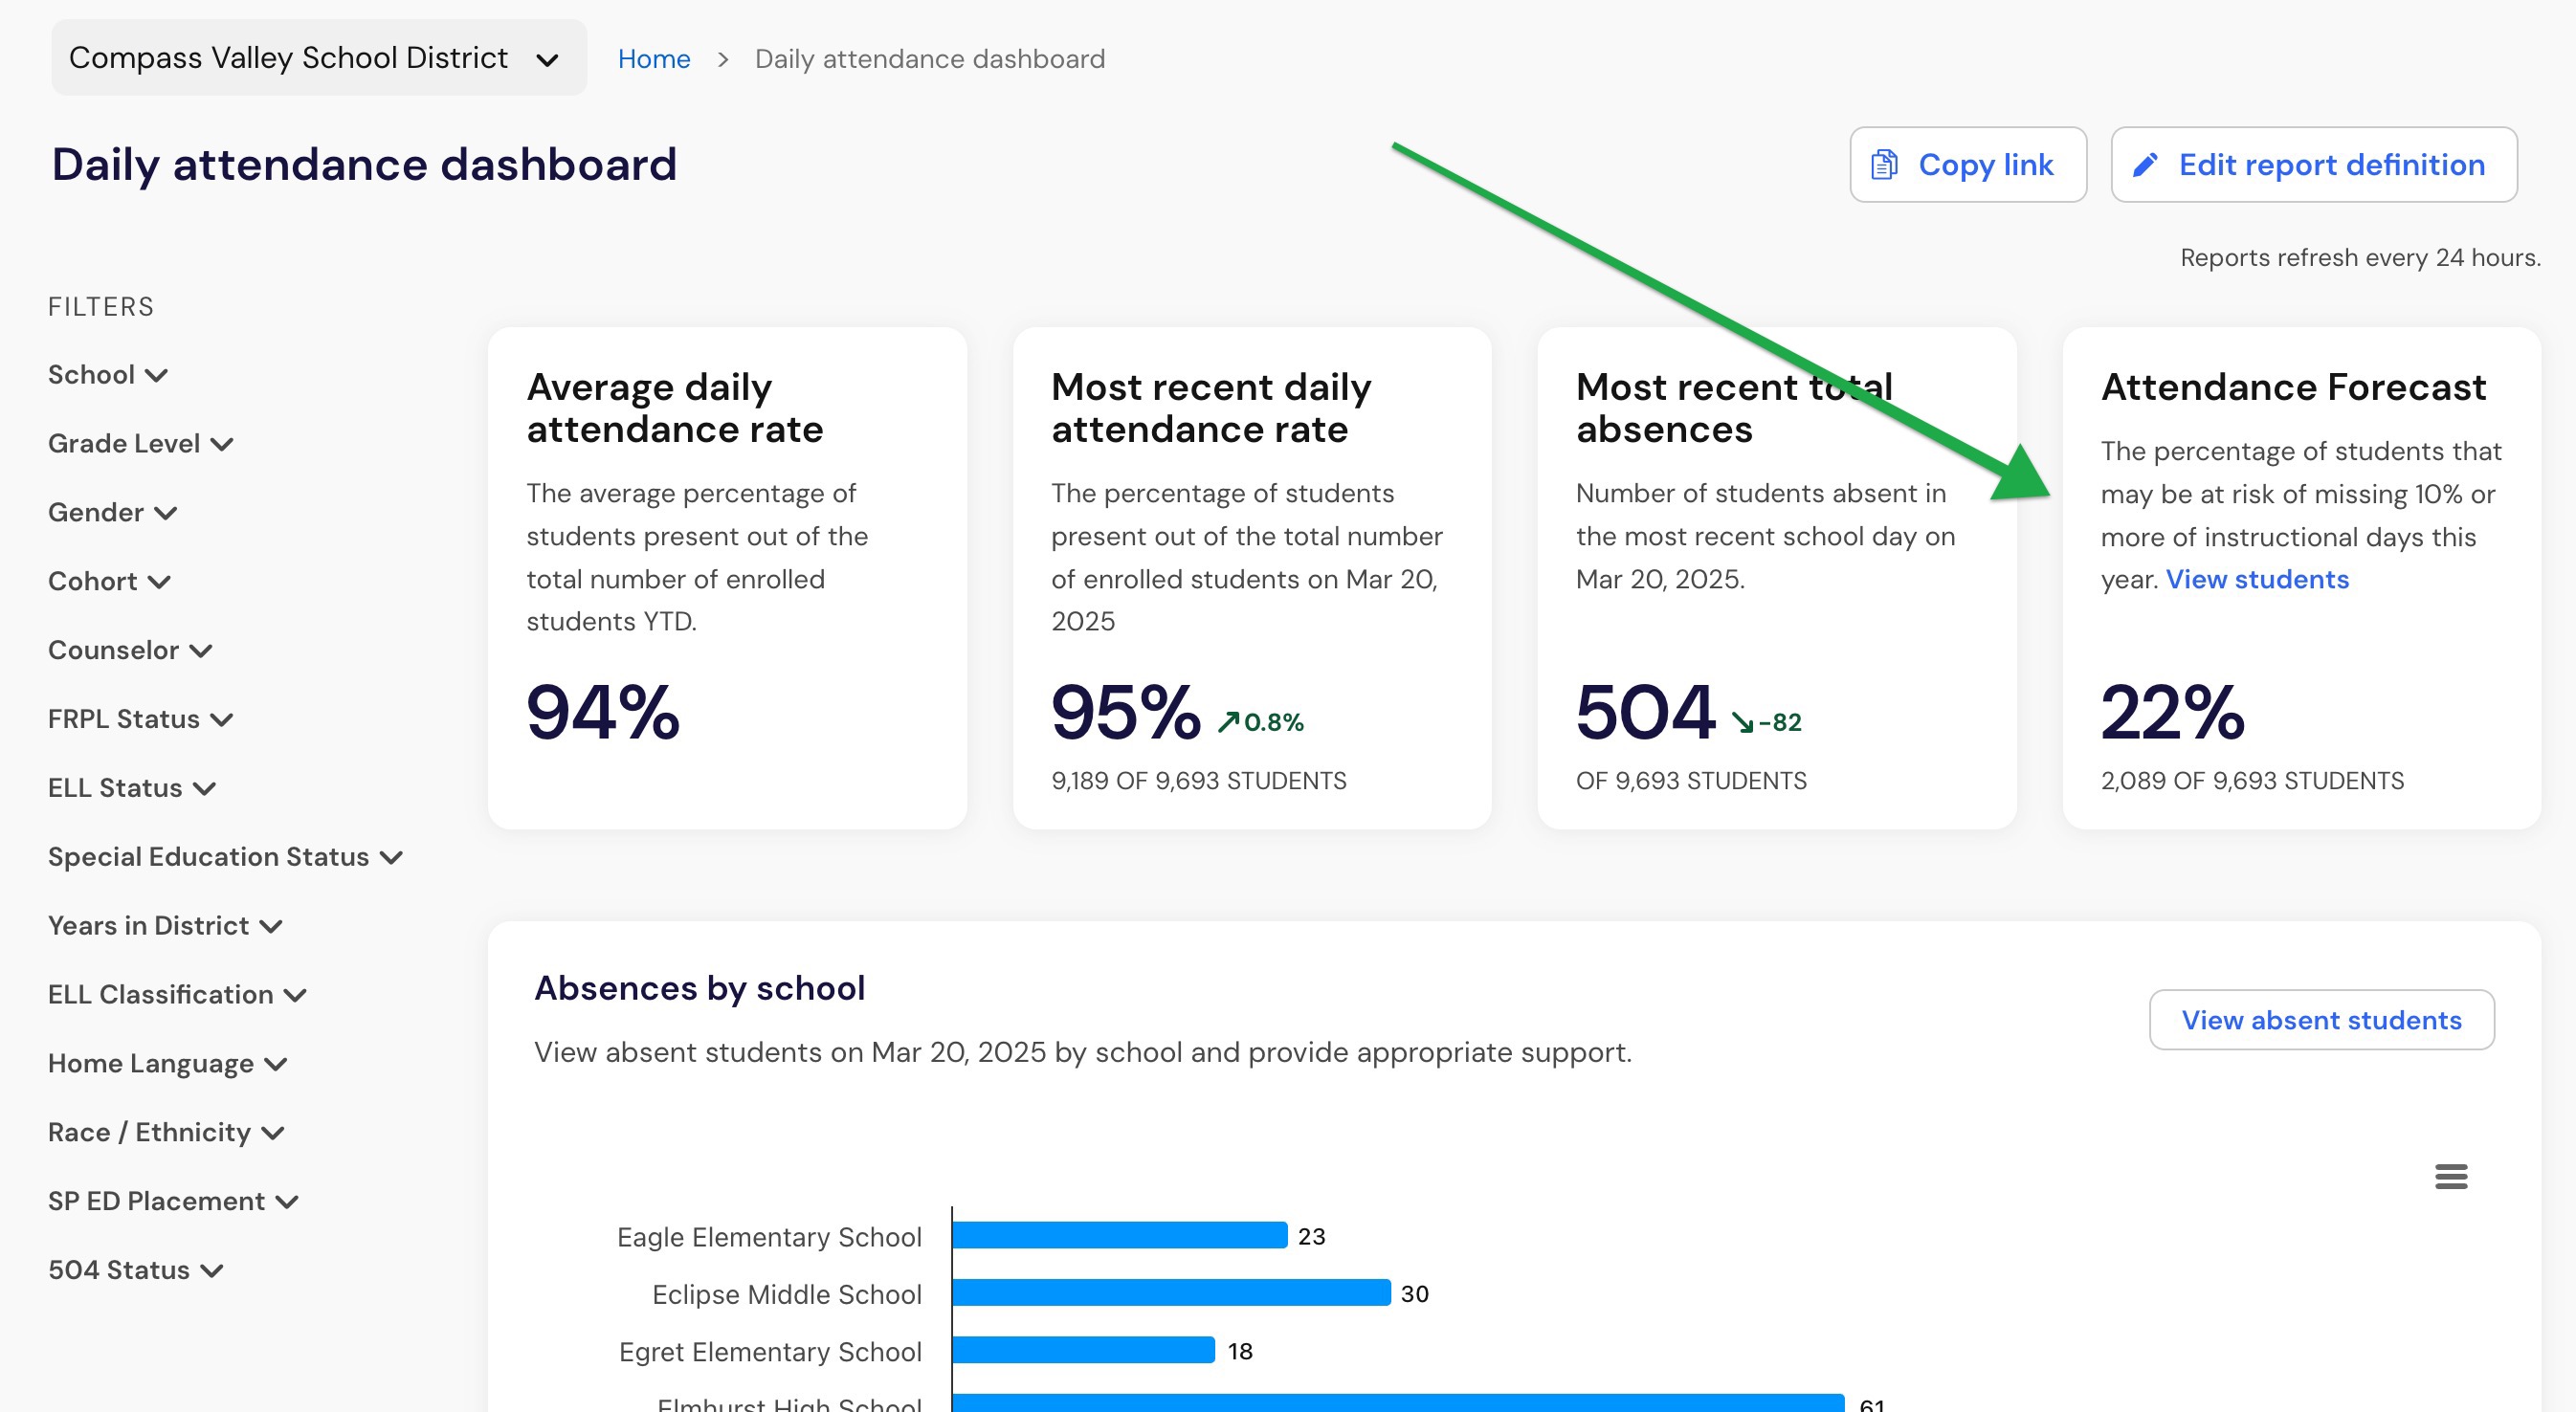
Daily Attendance Dashboard
Attendance Forecast on the Daily Attendance Dashboard aggregates the number of students with either Watch or Warning designations.
Student profile
In the student profile, the forecast appears alongside current attendance context so users can interpret risk in the full student picture.
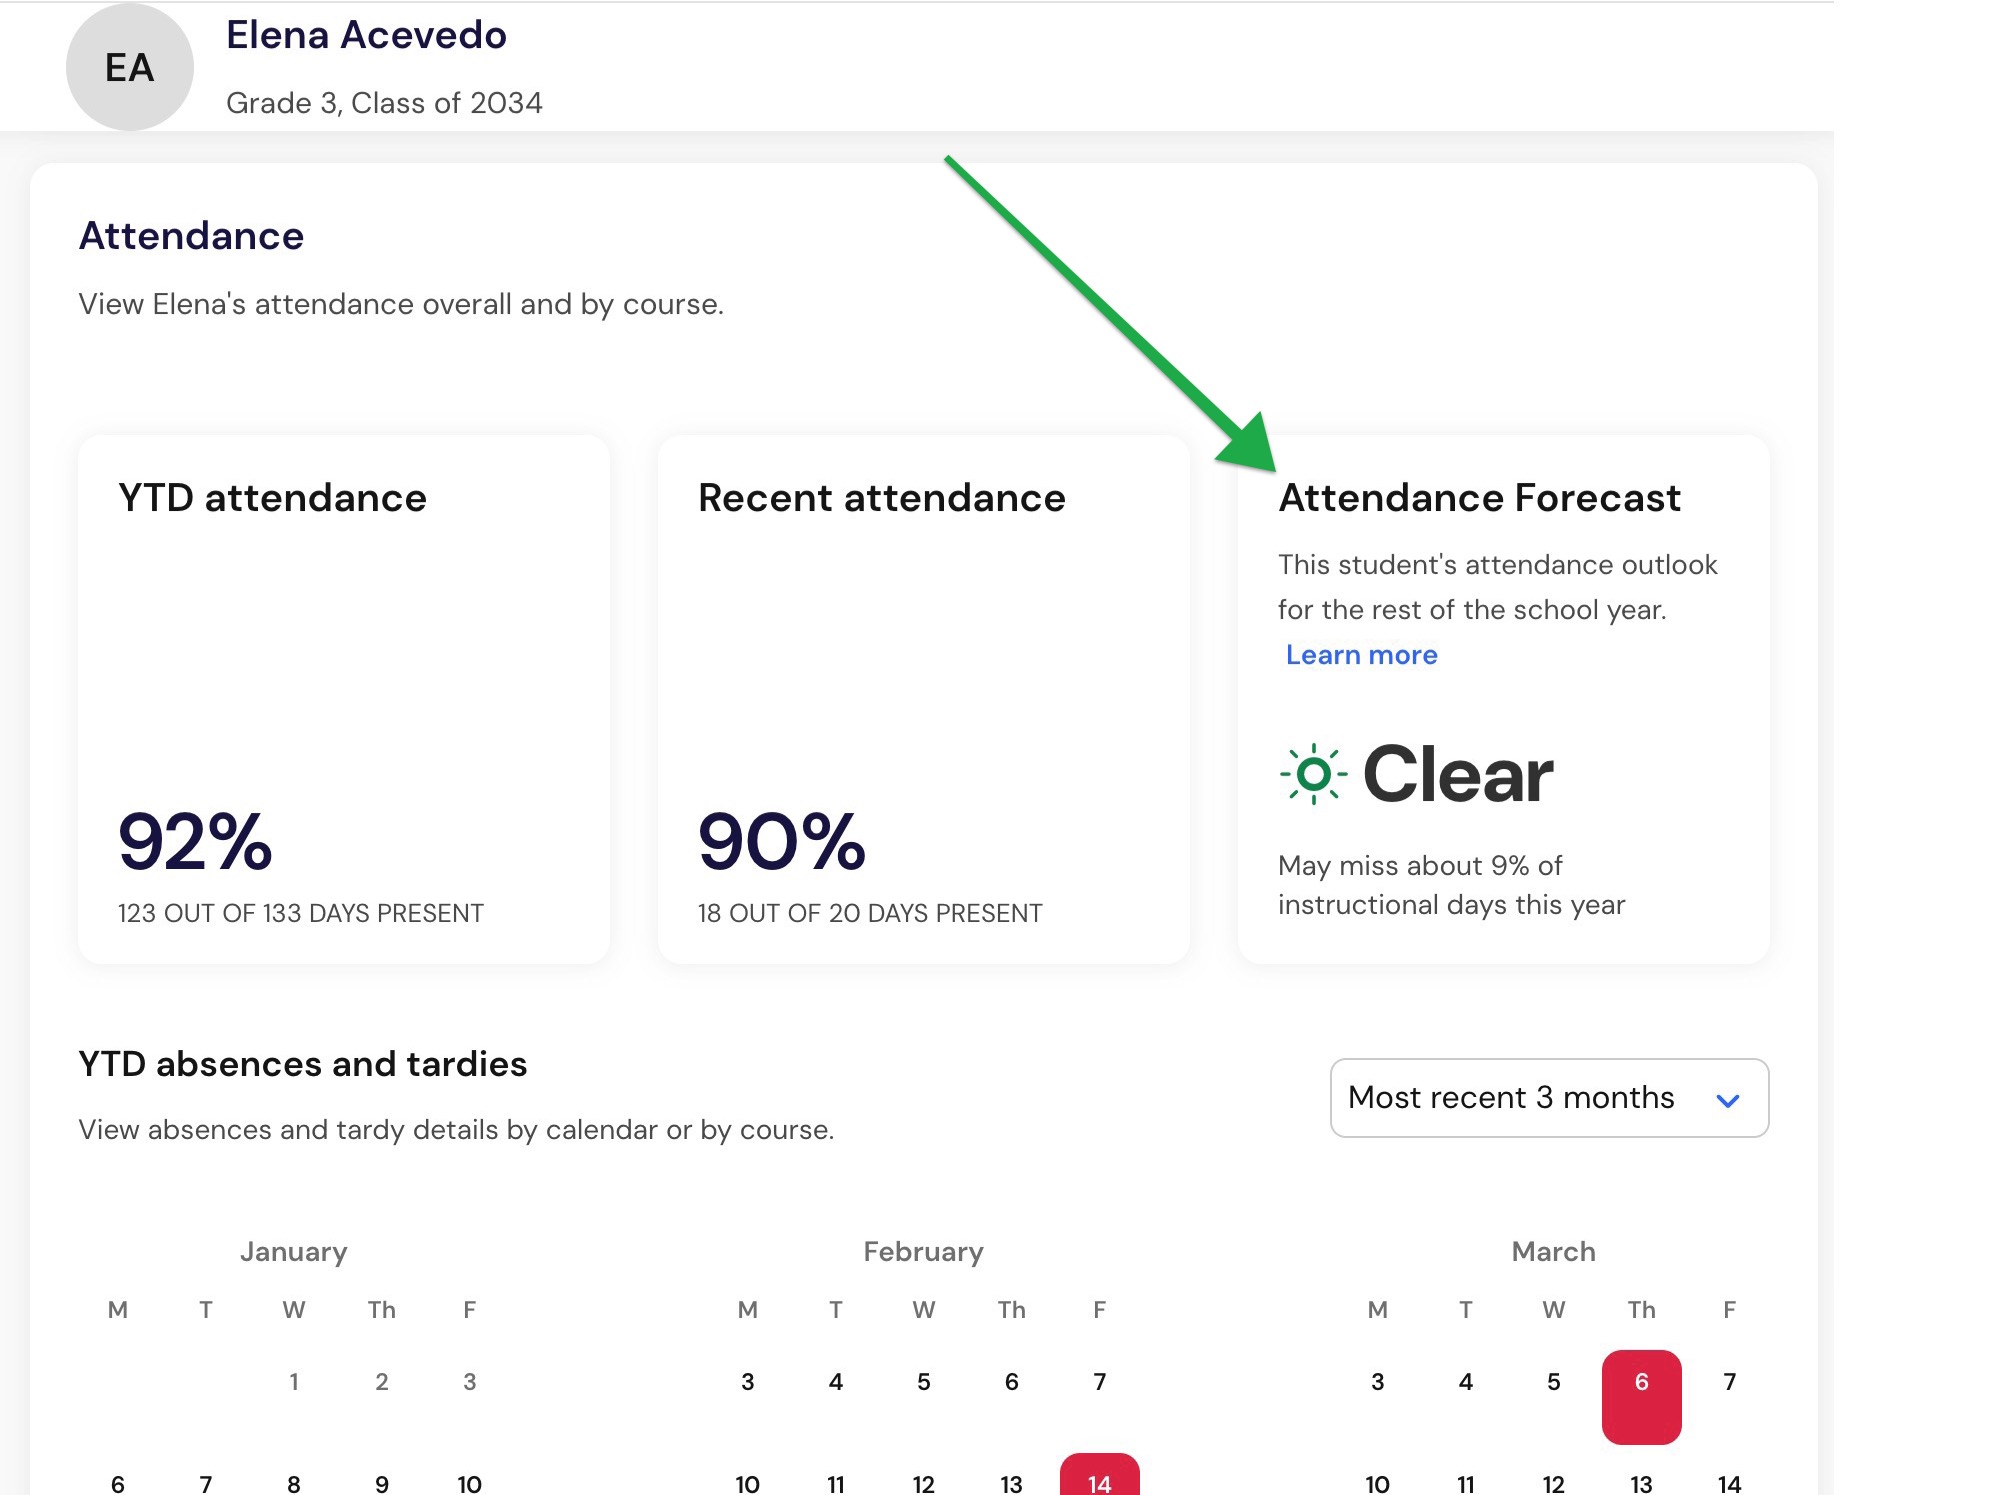
How educators should use the Attendance Forecast
When is Attendance Forecast most useful during the school year?
Attendance Forecast is most helpful in the early-to-middle part of the school year, once there is enough attendance history to identify a student’s emerging attendance pattern. The optimal time to use Attendance Forecasting is about a month into the school year.
Early in the year, between 1-20 school days, traditional attendance measures can be limited because a small number of absences may have an outsized effect on a student’s current absence rate. Attendance Forecast adds context by looking at both current absence rate and absence-pattern signals, such as whether absences are happening as separate events or in longer continuous stretches.
As the year progresses, Attendance Forecast can help educators identify students whose attendance patterns suggest they may be at risk for future absenteeism before they meet traditional chronic absenteeism thresholds. This makes it especially useful for prioritizing outreach and intervention planning while there is still time to support the student during the current school year.
Later in the school year, the forecast can still provide helpful context, but educators may rely more heavily on year-to-date attendance outcomes alongside other student information.
How to use the Attendance Forecast
Review a student’s current attendance information alongside the forecast category.
Use Clear, Watch, and Warning to prioritize which students may need outreach first.
Sort or filter student lists by forecast category to identify high-risk groups quickly.
Open the student profile for additional attendance context before taking action.
Use the forecast as an early signal to inform intervention planning, not as the only decision input.
Note: Attendance Forecast is a prioritization signal. It should support educator decision-making, not serve as a standalone determination of need or outcome.
What else to know
Attendance Forecast is not an AI feature. It uses a research-backed linear model with fixed inputs and coefficients, which helps make the behavior more explainable.
It also does not account for prior year attendance trends. The feature is year scoped, so each student has a new forecast for each school year.
Frequently asked questions
What exactly is being predicted?
Attendance Forecast displays a student’s projected full-year absence rate, not just the expected remainder-of-year rate.
Do excused absences, tardies, or partial-day absences count?
No. The Attendance Forecast uses only full-day absences. Partial absences and excused versus unexcused status are not included in the streak calculation.
Why can a student with fewer absences appear riskier?
Because absence patterns matter, a student with fewer total absences spread across many separate streaks may be more likely to continue missing school than a student with more absences concentrated in one continuous event.
Is this an AI feature?
No. Attendance Forecast uses a research-backed linear model with fixed inputs and coefficients.
When is the feature most useful during the year?
The signal is expected to be most valuable in the earlier and middle portions of the school year, especially once enough attendance history exists to establish a pattern. The strongest practical value is roughly between days 20 and 100 of the school year.
Does Attendance Forecast consider prior year attendance trends?
No. Attendance Forecast does not account for prior year attendance trends.
What happens for students with insufficient attendance history?
Attendance Forecast follows the same visibility rules as the current attendance indicator for students with limited attendance history. If the existing attendance experience limits what is shown for insufficient data, Attendance Forecast will do the same.
Does Attendance Forecast work everywhere?
Attendance Forecast is available on the new students overview experience. It will not work in Strategic Priorities Advisor.
What happens if a student transfers schools during the school year?
Attendance Forecast follows the same behavior as the current attendance experience for mid-year transfers. It only uses attendance data from the student’s current school context, so when a student moves to a new school, the forecast starts with the data available there and does not carry over attendance trends from prior schools in the district.